This work is the second part of my master thesis (part I). In this part, I developed an algorithm for 2D pose estimation of the human body. To do this, I created a software with QT that could generate 2D contours representing human body. Then I send these contours for evaluation to CNS(Contrast Normalized Sobel) [1] and finally picked the contours with the highest response.
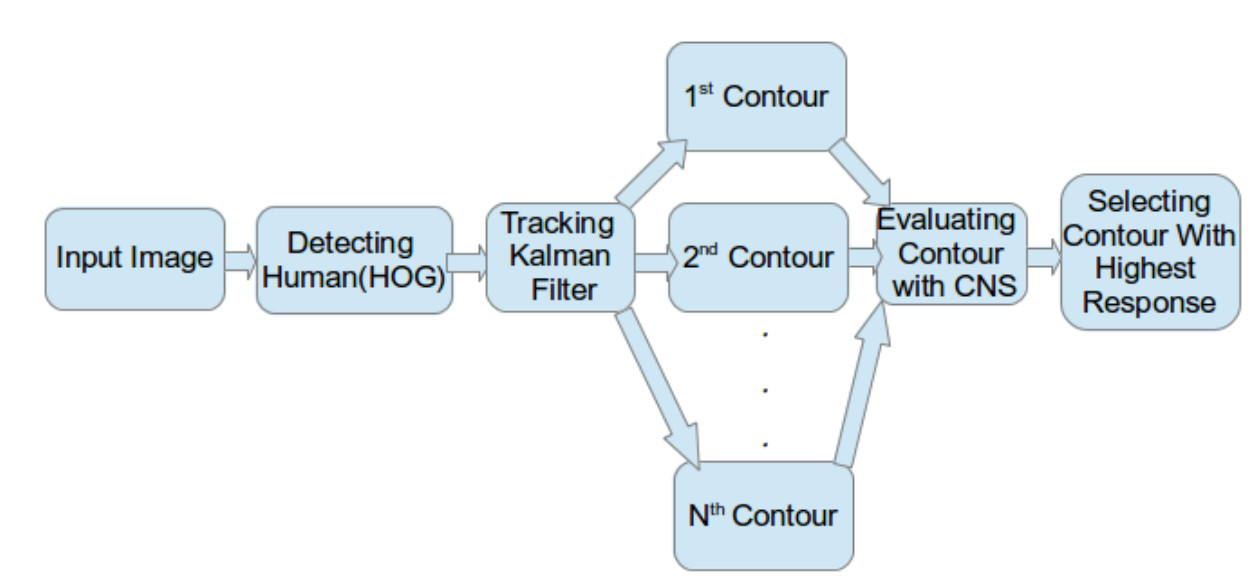
A 2D contour is a set of points connected to each other. By changing the relative
position of these points we can generate contours that can describe a human, car,
tree or any arbitrary shape in 2D space. In this work first, we need a system that
can generate 2D contour of a human in the different pose. After this step, we need
a system for evaluating the generated contour on an image to see how close is
the contour to the pose of player in the image.
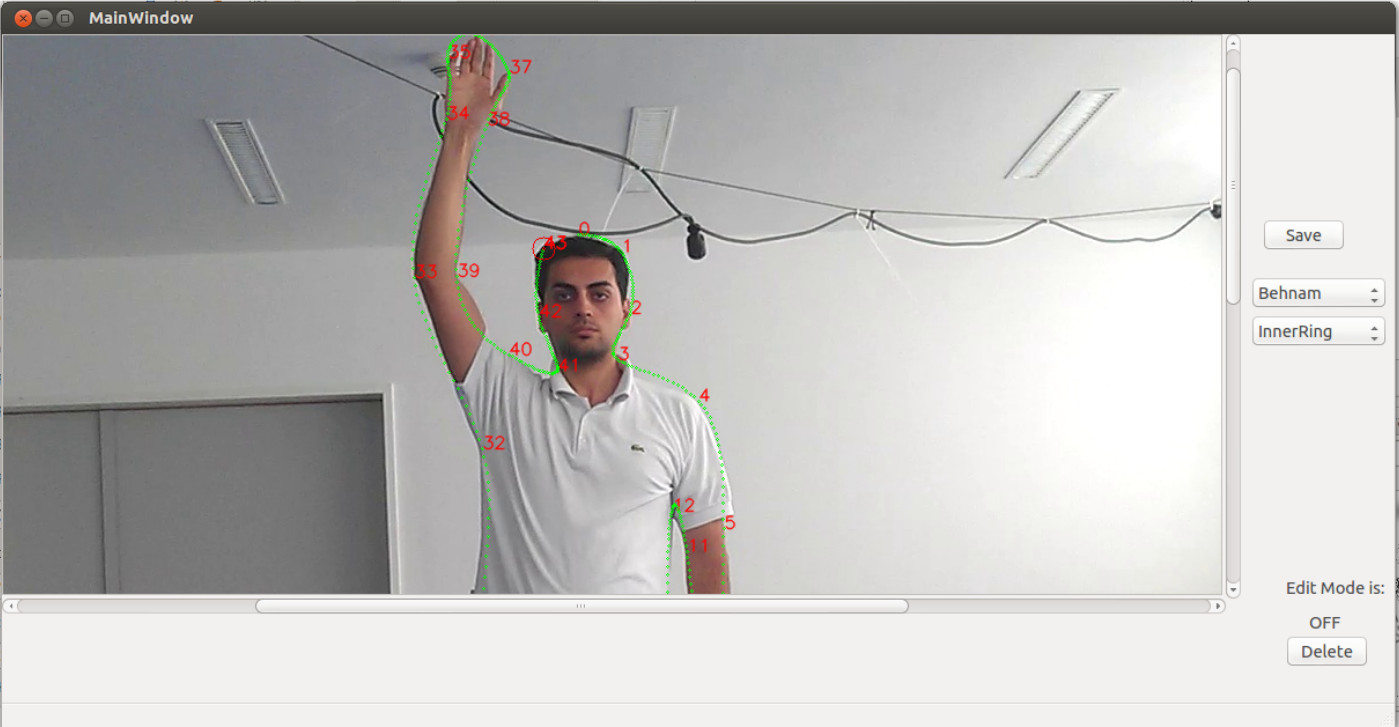
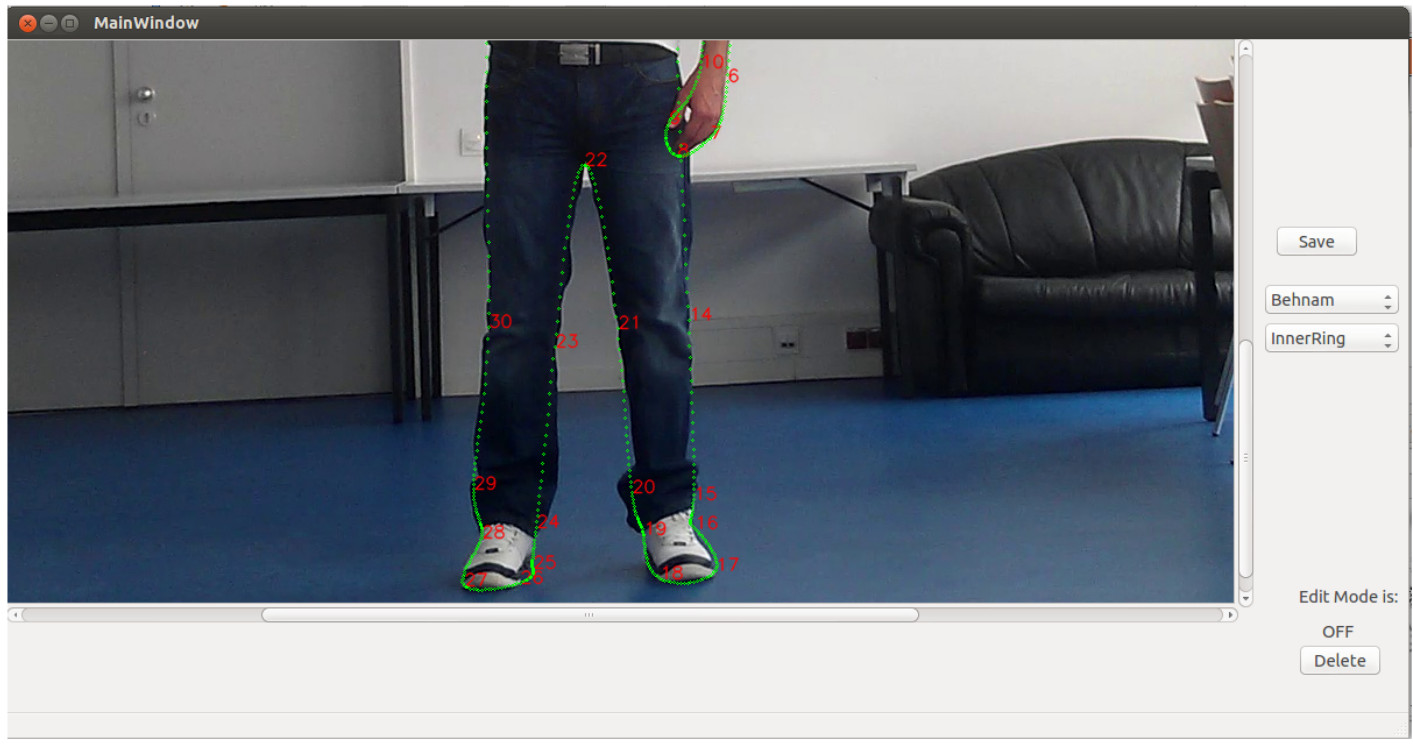
We considered 44 points on the human body to create a contour. These points are
pointing prominent part of the human body like the top of the head, ears, neck, shoulder,
elbow, wrist, knee, ankle and feet. There are several ways to connect these points
to each other i.e. straight lines, pronominal, different kind of curve fitting. In
order to make the contour smooth in a way, it could describe human body curves-
turns meanwhile keep it computationally inexpensive we used cubic splines for
connecting these point.
Now by changing the location of any these 44 points, the interpolated points would
also change and a new contour would be formed. But creating the contour by this method is pretty complicated and computationally expensive. We don’t know
how should we move these points to generate a contour of a human, furthermore
searching through 44 dimensions is computationally expensive.
To make an automatic way for generating human contours we created a training
set of several images of a player in different poses. Then we manually registered
these 44 key points on the body of the player in each individual image. Based on
the items in the training set, we can generate contours of human in the different pose
in detection phase.
We also tried to reduce the dimensions of our problem from 44 to some smaller
meaningful number. For that purpose, we used dimensionality reduction by PCA
(Principal component analysis).
We put the data regarding the x and y position of the point in these contours plus
the interpolated point as a raw entry in a matrix of data. In the next step, we tried to
find principal components of these data by finding the eigenvalue and eigenvector
of these data. After calculating the eigenvalues of these data in the matrix, we
sort them from largest value to smallest one and we pick those who contribute
90%. In the other words we sum up all the eigenvalues and then from sorted
eigenvalues in descending order (largest first) we contribute eigenvalues until the
sum of them is less than 90% of total eigenvalues.
To create a training set for the PCA (principal component analysis) we recorded
the activity of a player in different poses and we manually labeled these 44 key
points.
By selecting 44 points on each image and generating 3 interpolated points for each
pair of points and considering the (x,y) coordinates of each point our data would
have 44 × 2 × 4 = 352 dimension. To calculate PCA we have used OpenCV.
By taking into account the 90%, we found that
The optimal number of dimensions is 4 and we reduce our problem into 4 DOF.
To visualize the generated contour with these 4 parameters a software has been
designed with four sliders for each principal component respectively. By chang-
ing the position of each slider, a new value would be set for respective principal
component and by doing a back projecting with PCA, a new contour would be
generated and displayed on the image.
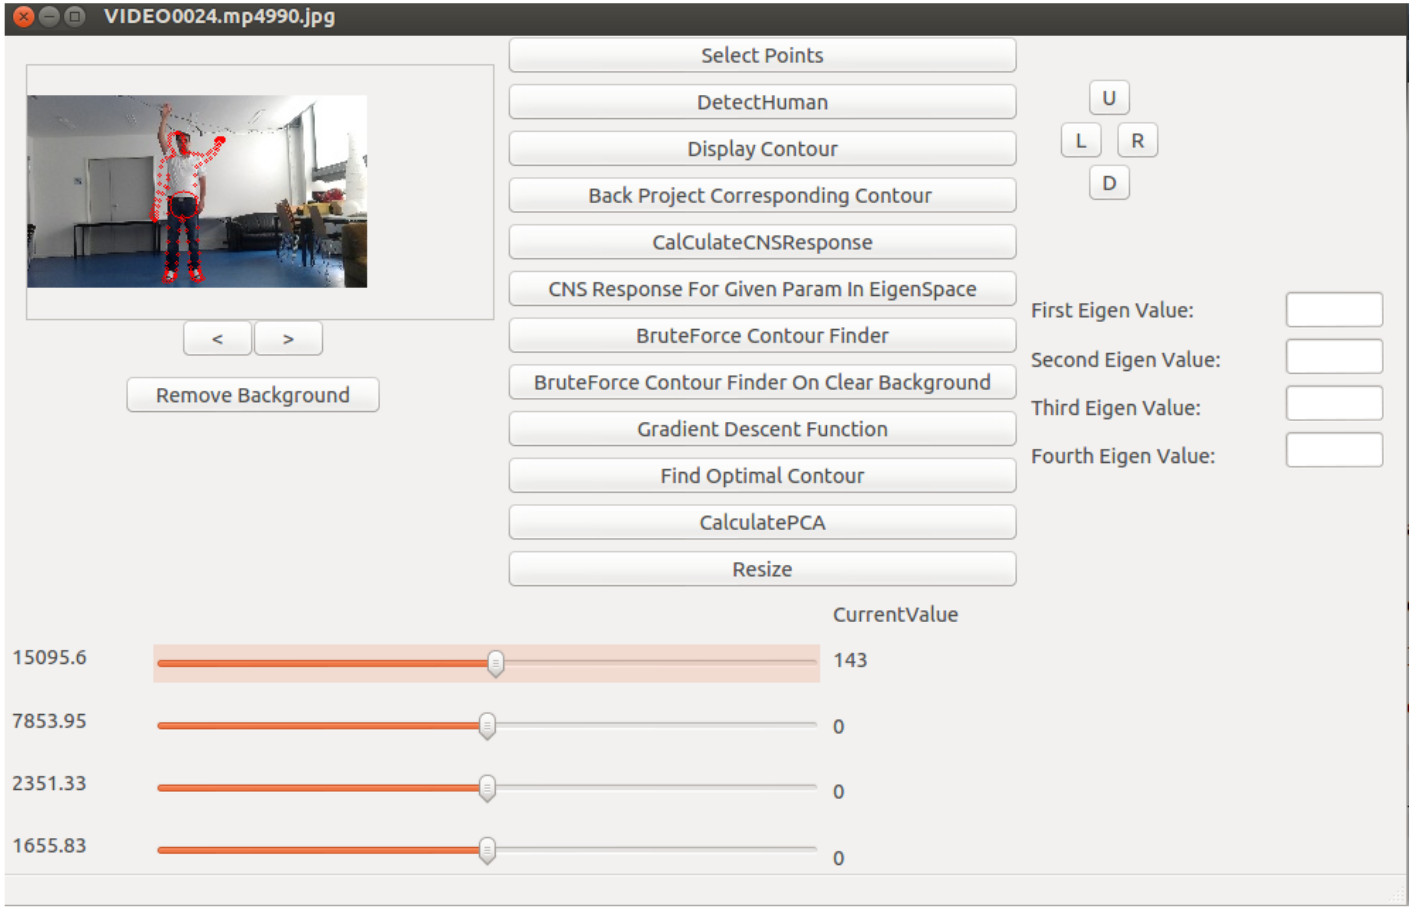
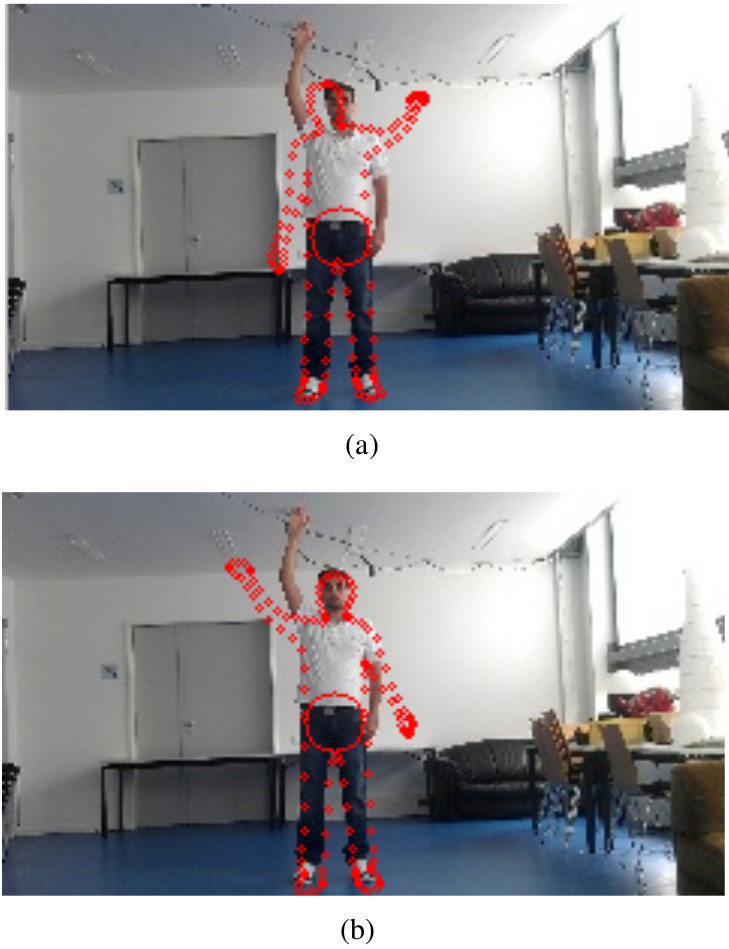
CNS response from optimal contour on image with clutter noise
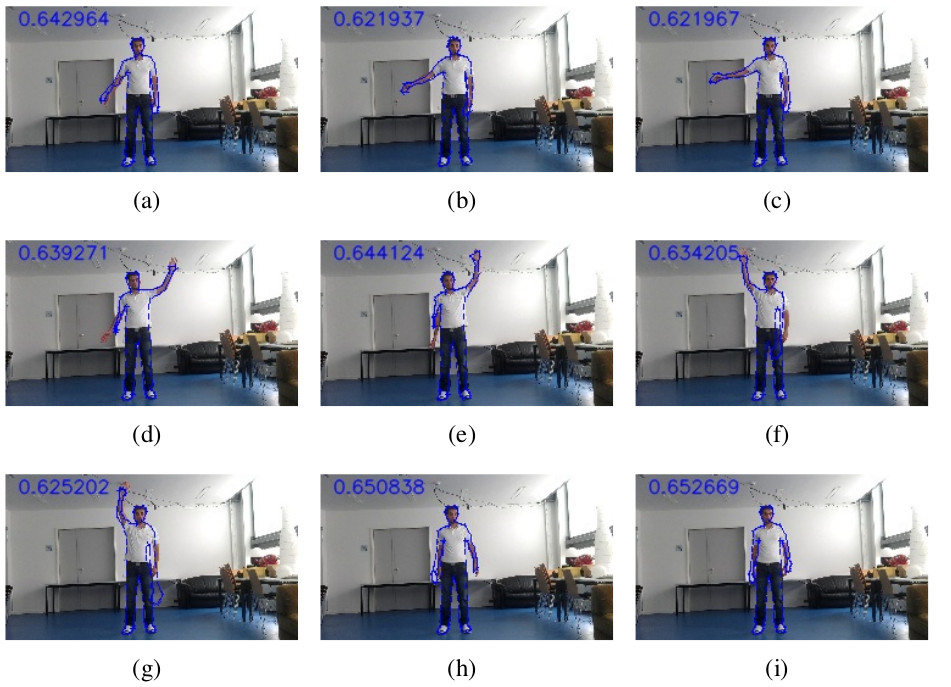
In this experiment for each image, several contours have been generated by brute
forcing all the four principal components in PCA space and the CNS response for
them has been calculated. The contour with the highest CNS response has been
selected. It should be remembered that the variance of each component is equal
to the corresponding eigenvalue. In other words, the standard deviation of the
component is equal to the square root of the eigenvalue. To determine the range
of values for each principal component, first, we calculate the square root of each
eigenvalue. Then the range of the search space for each principal component is
set to two times of the standard deviation. The maximum and minimum value for
each principal component observed in the labeled contour also endorses this range
and falls within this interval range.
CNS response from optimal contour on image with a clear background
estimated contour from brute force has been labeled rejected if at least one of the limbs of player (arms, hands, legs or feet) has been wrongly estimated otherwise it has been labeled as accepted. Overall 0.75% of estimated contours labeled as accepted contours.
All text and images in this article are taken from my master thesis, the full document can be downloaded here.
[1]Thomas Röfer Judith Müller, Udo Frese. Grab a mug – object detection and grasp motion planning with the nao robot. In Proceedings of the IEEE-RAS International Conference on Humanoid Robots (HUMANOIDS 2012), Osaka, Japan, 2012. URL http://www.informatik.uni-bremen.de/agebv2/downloads/published/muellerhumanoids12.pdf.
[…] is the part I of the work that I did for my master thesis (part II). In this work first, I computed HOG (Histogram of oriented gradients) on my images and then sent […]